

This post may contain affiliate links. If you purchase products or services linked from this page, Summit of Coin may receive a small commission at no extra cost to you.
Wow, what a year! We celebrated my daughter's first birthday and our 4 year anniversary in 2017. We made three trips to Nebraska to see family, most recently over the holidays. We had a great time playing cards and enjoying each other's company. We are now diving back into our busy lives.
Along with the celebrations, we dealt with multiple car repairs, an A/C repair and a breakdown & replacement of both our washer and dryer. All of these unexpected expenses slowed down our debt payoff and our savings rate.
That's life, it will throw you curveballs! We were lucky to be able to still save some despite all of our extra little expenses that popped up during the year. At the beginning of 2017, we set a savings goal of 35%. Despite our three month challenge to buy nothing new, we still came in under our goal.
October Spending Report

The image above shows our October 2017 spending rate. Below is the percentage breakdown of the spending rate:
- Savings: 22%
- Household: 14%
- Daycare: 13%
- Groceries: 13%
- Mortgage: 11%
- Auto: 7%
- Utilities: 4%
- Donations: 4%
- Other: 12%
In the month of October, we dealt with our washer and dryer malfunctioning. This caused us to go out and purchase new washer and dryers. This was unexpected and took up 14% of our spending in the month of October. All other expenses were expected. Our groceries expense was higher than we like, but we do a good job of cutting back on groceries in December.
November Spending Report
The image above shows our November 2017 spending rate. Below is the percentage breakdown of the spending rate:
- Savings: 25%
- Mortgage: 13%
- Groceries: 13%
- Medical: 11%
- Daycare: 9%
- Dining: 6%
- Utilities: 5%
- Donations: 3%
- Other: 15%
In the month of November, our expenses were on track with the rest of the year. We saved around 25% and dealt with only two categories out of the ordinary. Our grocery category and medical category were both higher than we originally expected.
Medical was higher in November, because we paid for my surgery to remove my wisdom teeth. I had planned on using our health savings account (HSA) to make this purchase, but we changed our minds and decided to wait and use the (HSA) for the birth of our second child.
That's right, my wife is pregnant!! That makes 2018 an exciting year for the Summit of Coin family!
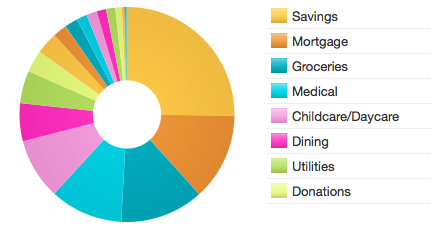
December Spending Report

The image above shows our December 2017 spending rate. Below is the percentage breakdown of the spending rate:
- Auto: 29%
- Savings: 20%
- Mortgage: 8%
- Daycare: 8%
- Gifts: 6%
- Donations: 5%
- Vacation/Travel: 4%
- Groceries: 4%
- Other: 16%
In the month of December, we were hit with the repair bug. My wife's car needed new struts, new tires and we decided to add on a tune up, because we were driving her car to Nebraska. With my wife receiving three paychecks in December, we had planned on dumping a lot of money towards savings, but that plan changed when we learned of the repairs that were needed.
2017 Savings Rate Breakdown
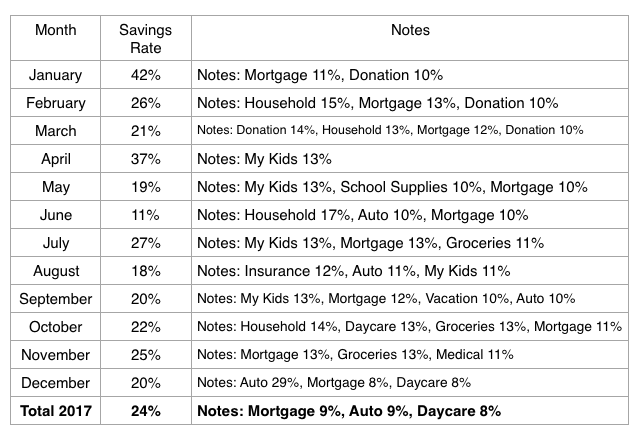
In October, I began splitting up the tracking of daycare expenses and all other my kids expenses. This allows me to track minor expenses for my daughter better without sifting through all of the daycare expenses each month. The last three months and yearly percentages reflect this change in tracking expenses.
Over the last three months, we did not hit our savings goal in any month. This has caused our savings rate to drop 1 point to 25% since June. Below is the complete data of the yearly spending rate.
- Savings: 24% - Decreased 1% from September
- Mortgage: 9% - Increased 1% from September
- Auto: 9% - Increased 2% from September
- Daycare: 8% - Decreased 1% from September
- Groceries: 8% - No change from September
- Household: 7% - Decreased 1% from September
- Donations: 6% - Decreased 1% from September
- Utilities: 5% - No change from September
Spending Rate Comparison By Year
2014 Savings Rate: 29%
2015 Savings Rate: 40%
2016 Savings Rate: 32%
2017 Savings Rate: 24%
Well, we just suffered our worst year of saving since I began tracking our spending in 2014 and we did not meet our 35% savings goal in 2017. I could always blame the low savings on the surprise expenses that continued to pop up in 2017. However, we need to take some ownership for the low savings number. Both of us want to pay off our house and take a mini-retirement. This will require us to clamp down and reach our savings goal in 2018!
In 2018, we are adjusting our savings goal a little and shooting for a 30% savings rate. Yes, this is lower than in previous years, but also higher than the amount we saved last year.
FIRE Prowess Update
As a quick reminder, the FIRE Prowess is a way to track your net worth gain when compared to your income in a given year. A FIRE Prowess of .5 or 50%, means that your net worth gain was half of your income that year. A score of 1 or 100% means that your net worth grew the same amount as your income.
The higher your score, the better. It is calculated by taking the Net Worth Gain divided by Yearly Income. You can learn more by reading, "Savings Rate or FIRE Prowess Gauge?" Below is our most recent update of our FIRE Prowess Score:
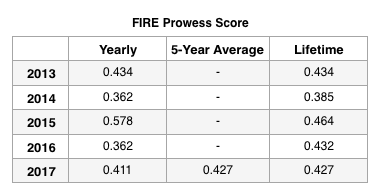
Based on our numbers, our net worth grew at 41.1% of our income in 2017. What does this really mean? Let me use an example to help you with a random income (not our income at Summit of Coin). Let's assume a family has an income of $100,000. With a FIRE Prowess Score of 41.1%, this families net worth grew $41,100 in 2017 (41,100/100,000 = 41.1%).
Let's use a smaller income to show the exact same math. Let's assume that a families income is $50,000. With a FIRE Prowess score of 41.1%, this families net worth grew $20,550 in 2017 (20,550/50,000 = 41.1%)
With a .411 or 41.1% FIRE Prowess Score, my family is seeing a good amount of growth in our net worth on a yearly basis. The one year indicator is great, but the biggest indicator of wealth accumulation is the 5 year average. I will show two more examples below.
Let's use the same scenario from above with a family making $100,000 a year for five years. If their average FIRE Prowess is .427 over 5 years, this means their net worth has increased at around $42,700 each year for 5 years. Over the course of five years, this family would have seen their net worth grow by $213,500 ($42,700 x 5 = $213,500). If this family continues on this path, they will become millionaires in approximately 23 years.
Now, let's look at the family with a $50,000 income and a FIRE Prowess Score of .427 over 5 years. This family has had their net worth increase by $21,350 each year for the past five years, increasing their net worth by $106,750 ($21,350 x 5 = $106,750) over those 5 years.
As you begin to build more wealth (investments), your FIRE Prowess and net worth should begin to increase at a faster rate each year. Eventually, the FIRE Prowess score should reach 100% or more. Once you reach the point in which your net worth is increasing by more than your income, then you could start to think about retirement.
As for the Summit of Coin family, our net worth still increases every year and we are happy with the increase, but we still have work to do to reach the proverbial "financial summit."
Have you tracked your Net Worth yet? Has your Net Worth been increasing or decreasing? Answer in the comment sections below.
Reaching the Financial Summit, Starts with You!