
This post may contain affiliate links. Please read my disclosure for more information.
One of the best ways to reach financial independence is to have a high savings rate. Each year we push for increased savings and set a savings rate goal. This year, we are shooting for a 35% savings rate, so let's find out if we are on track to hit this 35% goal in the first 3 months of the year.
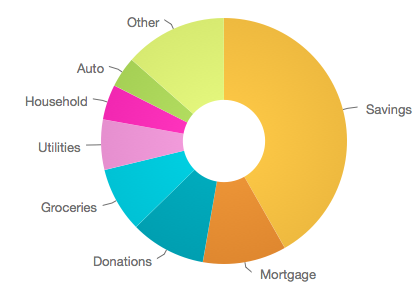
The image above shows our 2017 January spending rate, which shows over half our spending going towards Savings and Mortgage expenses. Below is the percentage breakdown of the spending rate:
- Savings: 42% (includes principal from mortgage)
- Mortgage: 11% (only includes taxes & interest)
- Donations: 10%
- Groceries: 9%
- Utilities: 7%
- Household: 5%
- Auto: 4% (Registration, Gas, Oil Change and Tolls)
- Other: 12%
I was pleasantly surprised to find out that our savings rate was above our 35% goal for the month and it sets us up on a good solid footing for the remainder of the year. Nothing crazy happened this month and we were able to focus on savings. Our savings and mortgage expenses are over half of our expenses for January. That's good news for the future (when the house is paid off). Next, let's look at the February 2017 spending chart.

The image above shows our 2017 February spending rate, which shows over half our spending going towards Savings, Household and Mortgage. Below is the percentage breakdown of the spending rate:
- Savings: 26% (includes principal from mortgage)
- Household: 15% (shelving for our garage)
- Mortgage: 13% (only includes taxes & interest)
- Donations: 10%
- Groceries: 9%
- Utilities: 5%
- Insurance: 5%
- Other: 17%
As you will notice, the savings rate dropped drastically in February. This can be attributed to multiple things, but the largest one was that we lived on a smaller income due to my wife's maternity leave. Not only did we live on a smaller income, but we also purchased and installed shelving for our garage. The shelving was a great way to organize, but did cut into our ability to save more money. Next, let's look at the March 2017 spending chart.

The image above shows our 2017 March spending rate, which shows that our spending was pretty evenly dispersed between savings, donations, household and mortgage. Below is the percentage breakdown of the spending rate:
- Savings: 21% (includes principal from mortgage)
- Donations: 14% (Normal donation plus an extra donation)
- Household: 13%
- Mortgage: 12% (only includes taxes & interest)
- Groceries: 10%
- My Kids: 7%
- Utilities: 4%
- Other: 13%
We were below our savings goal in March. This can be attributed to the extra donation at church our household expenses. We got a lot of random stuff this month for the house, like more shelving, storage tubs and a will package. I included getting our will done in household expenses, because it seemed like the best category for that expense.
March was also the first month that 'My Kids" jumped onto the data list. This was the first month that we had daycare expenses included in our spending. Daycare will be an added expense that we will have to prepare for each month for a couple of years.
Next, let's look at the three months together and find our yearly savings rate.
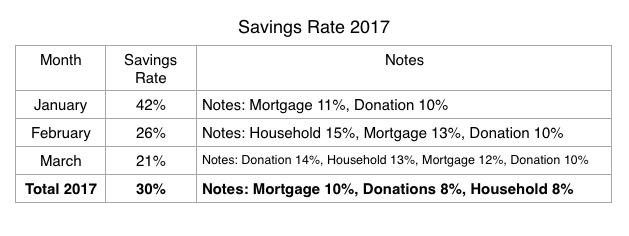
Year 2017 got off to a good start, but we have struggled to meet our goal since the beginning of the year. Below is the complete data of the yearly spending rate.
- Savings: 30% - Decreased 2% from December
- Mortgage: 12% - Increased 2% from December
- Donations: 11% - Increased 3% from December
- Household: 11% - Increased 3% from December
- Groceries: 9% - Increased 2% from December
- Utilities: 5% - No change from December
- Auto: 3% - Decreased 4% from December
Lastly, I want to compare the savings rate from 2014, 2015, 2016 and 2017..
2014 Savings Rate: 29%
2015 Savings Rate: 40%
2016 Savings Rate: 32%
Current 2017 Savings Rate: 30%
Three months into 2017, we have put ourselves into a savings hole and need to find ways to increase our savings rate to reach our goal. With the added daycare expenses, we will need to find other ways to cut expenses and increase savings.
Reaching the Financial Summit, Starts with You!
You can track your spending and develop reports like the charts used in this article by signing up for Personal Capital below. There is no charge for this great service, so sign up now!