
This post may contain affiliate links. Please read my disclosure for more information.
We are now half way through the year with the arrival of July. This calls for an update on the Summit of Coin family spending. Things for our family have become really interesting and our savings has not been up to our normal Summit of Coin Savings. With the start of our daughter in daycare and other expenses, we did not reach our savings goal over the past three months. Our goal is 35% for the entire year (with an understanding that some months will be better and some will be worse.) Let's jump into our April spending report.
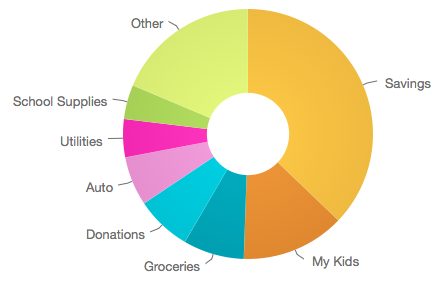
The image above shows our April 2017 spending rate. Below is the percentage breakdown of the spending rate:
- Savings: 37%
- My Kids: 13% (daycare and other misc. expenses)
- Groceries: 8%
- Donations: 7%
- Auto: 6% (Repair, Gas, Tolls)
- Utilities: 5%
- School Supplies: 5%
- Other: 19%
With as negative as I was in the introduction, you might be surprised that we saved so much money in April. We actually saved 37% of our income in April, but we did not pay a mortgage payment in April. We were actually a month ahead and decided to use that to our advantage. In April, there were two new expenses with the My Kids category and school supplies reaching the top of our spending. With my job of coaching, I purchased some supplies for the baseball team in April and I was later reimbursed by the school. The big expense that will become a regular is My Kids. The My Kids category includes daycare which officially started in April. Next, let's look at the May 2017 spending chart.
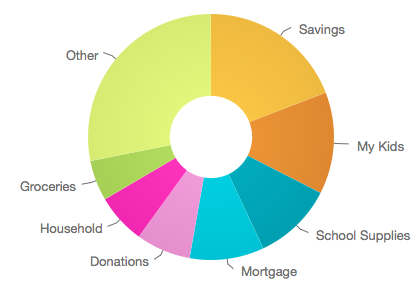
The image above shows our May 2017 spending rate. Below is the percentage breakdown of the spending rate:
- Savings: 19% (includes principal from mortgage)
- My Kids: 13% (daycare and other misc. expenses)
- School Supplies: 10%
- Mortgage: 10% (only includes taxes & interest)
- Donations: 7%
- Household: 7%
- Groceries: 5%
- Other: 29% (Pets [vaccinations], Auto, Vacation [Nebraska visit], Utilities, etc.)
Dang! That was a huge drop off in savings for the month of May. Once again, school supplies affected our savings rate. This time it was not baseball, but I run the festival at school and I purchased a lot of the items myself. I was later reimbursed, it just hurts our May Spending. Other than the school supplies expense, there was nothing out of the ordinary. Next, let's look at the June 2017 spending chart.
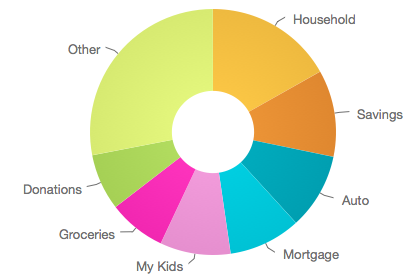
The image above shows our June 2017 spending rate, which shows a new #1 on spending for the first time in two years. Household expenses take the cake for highest spending in June. Below is the percentage breakdown of the spending rate:
- Household: 17% (A/C Repair and other misc. expenses)
- Savings: 11% (includes principal from mortgage)
- Auto: 10% (Repair, Gas, Tolls)
- Mortgage: 10% (only includes taxes & interest)
- My Kids: 9% (daycare and other misc. expenses)
- Groceries: 8%
- Donations: 7%
- Other: 28% (Health & Fitness, Dining, Vacation [Weekend Getaway], Utilities, etc.)
June was not a very fun month in terms of savings. Our savings was depleted by a couple of expenses. First, we were having trouble with our A/C and had to have it repaired. This caused a $2,400 expenses. Second, I blew my tire and destroyed my wheel. This required a car repair in the middle of the month. Both of these expenses alone totaled over $3,000 dollars and that took $3,000 away from our savings account.
Related: Americans Not Saving for Emergencies (luckily we had savings for this type of emergency)
Next, let's look at the first six months of 2017 and find out if we are on track to hit our savings rate.
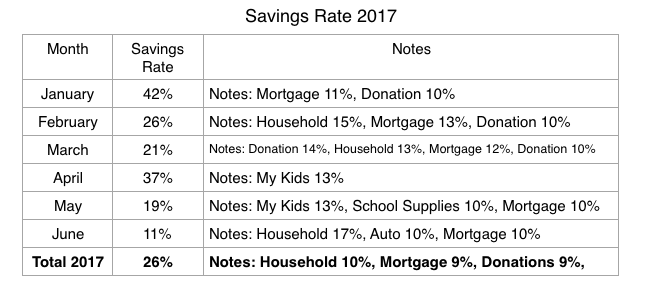
With the addition of daycare and some unexpected expenses, we have only hit our savings goal twice this year. This has caused our savings rate to drop 4 points to 26%. Below is the complete data of the yearly spending rate.
- Savings: 26% - Decreased 4% from March
- Household: 10% - Decreased 1% from March
- Donations: 9% - Decreased 2% from March
- Mortgage: 9% - Decreased 1% from March
- My Kids: 8% - Increased 5% from March
- Groceries: 8% - Decreased 1% from March
- Utilities: 5% - No change from March
- Auto: 5% - Increased 2% from March
Lastly, I want to compare the savings rate from 2014, 2015, 2016 and 2017.
2014 Savings Rate: 29%
2015 Savings Rate: 40%
2016 Savings Rate: 32%
Current 2017 Savings Rate: 26%
Six months into 2017, we find ourselves 9 points under our savings goals. This may not sound too good, but I believe that we can get our savings up to 35% by the end of the year. Look for our 3rd quarter spending rate article in early October to see if we are still on track.
What are your savings goals? Are you and your family on track to meet your goal?
Reaching the Financial Summit, Starts with You!
You can track your spending and develop reports like the charts used in this article by signing up for Personal Capital below. There is no charge for this great service, so sign up now!